How to create a histogram in word 2013
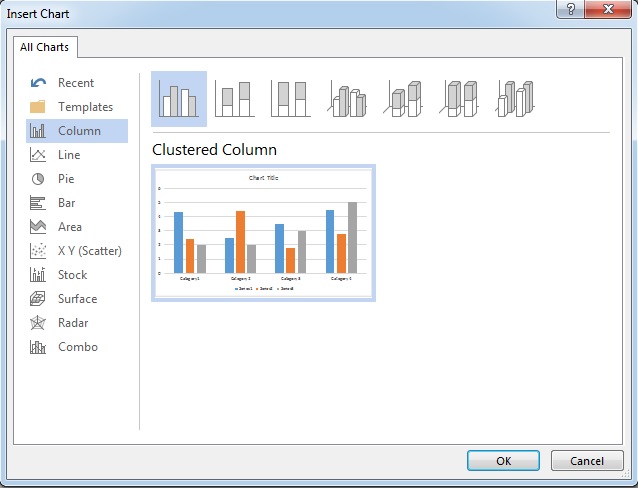
- Click “INSERT” and then click “Chart”
- Select “Clustered Column” and then click “OK”
- Enter your data.
- Click on chart that was shown.
- Click “DESIGN”
- Click “Quick Layout”, then select and click “Layout 8”


How to change the element of chart (histogram)
For example, I will share how to change the color of data point below.
- Click on “Data Point”
- Click “Shape Fill”
- Select and click the color that you want.


How to edit the data of chart (histogram)
- Click on chart area
- Click “DESIGN” and then click “Edit Data”
- Click “Edit data”
