How do I create graphs on excel?
- Launch Microsoft excel
- Enter you data on table
- Block your data that you will create the graph
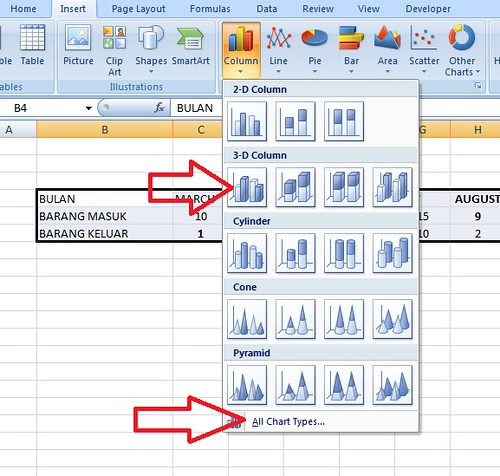
- Click “insert”
- Choose the type of graph that you want
- Then the graph will show automatically
- The graph showed without any information. You can add any information by clicking the graph, then click “Layout”. For example you can add title by clicking “Chart title” etc.
- Finish.